COMMENTS

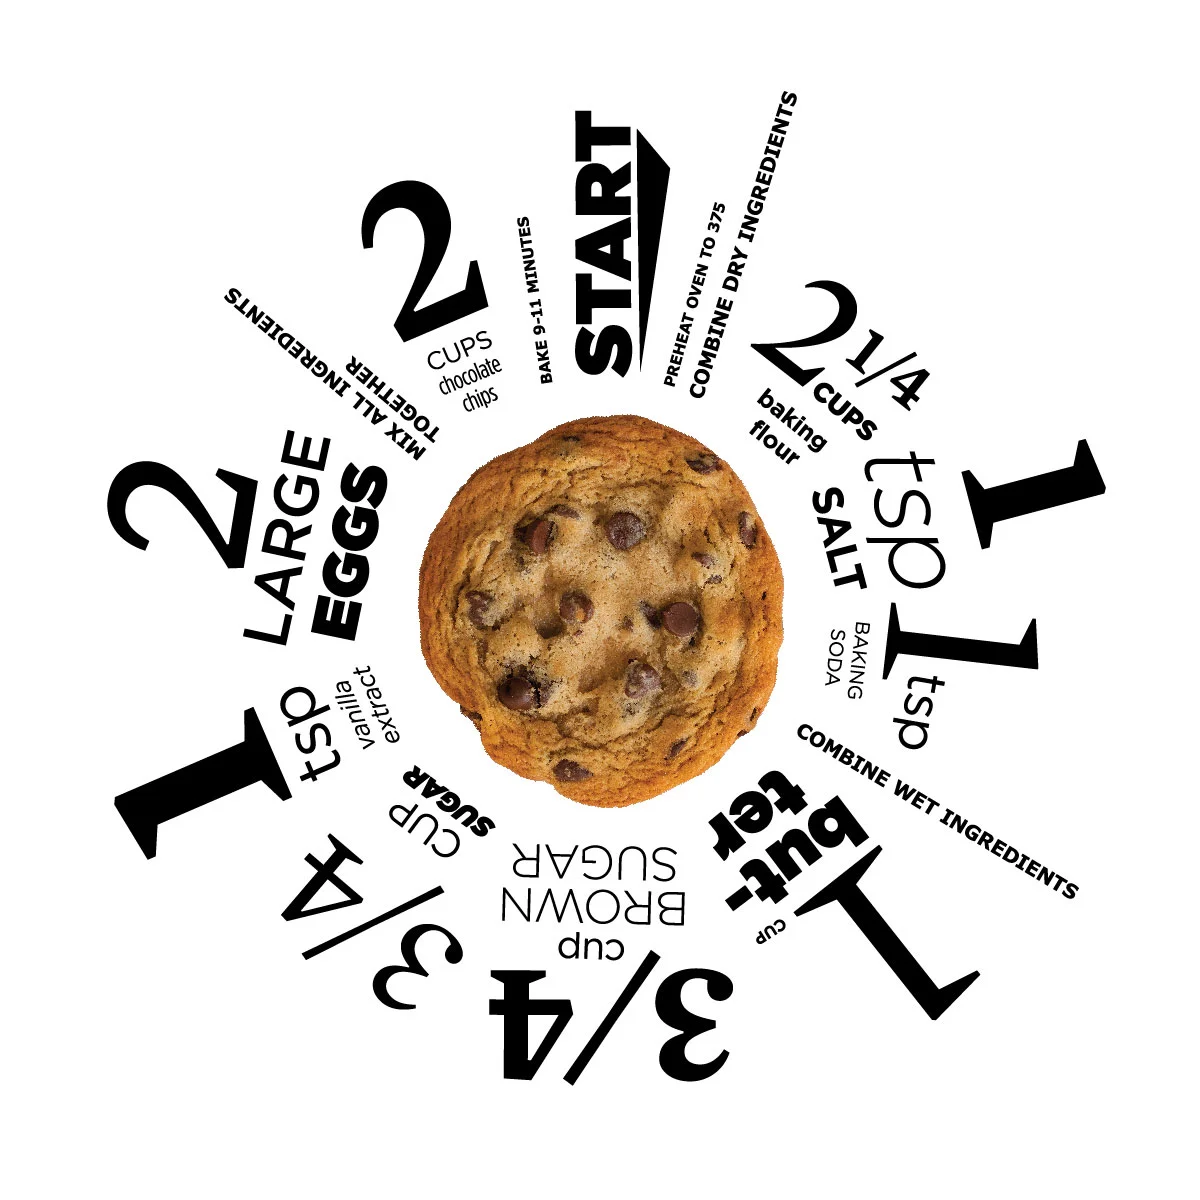
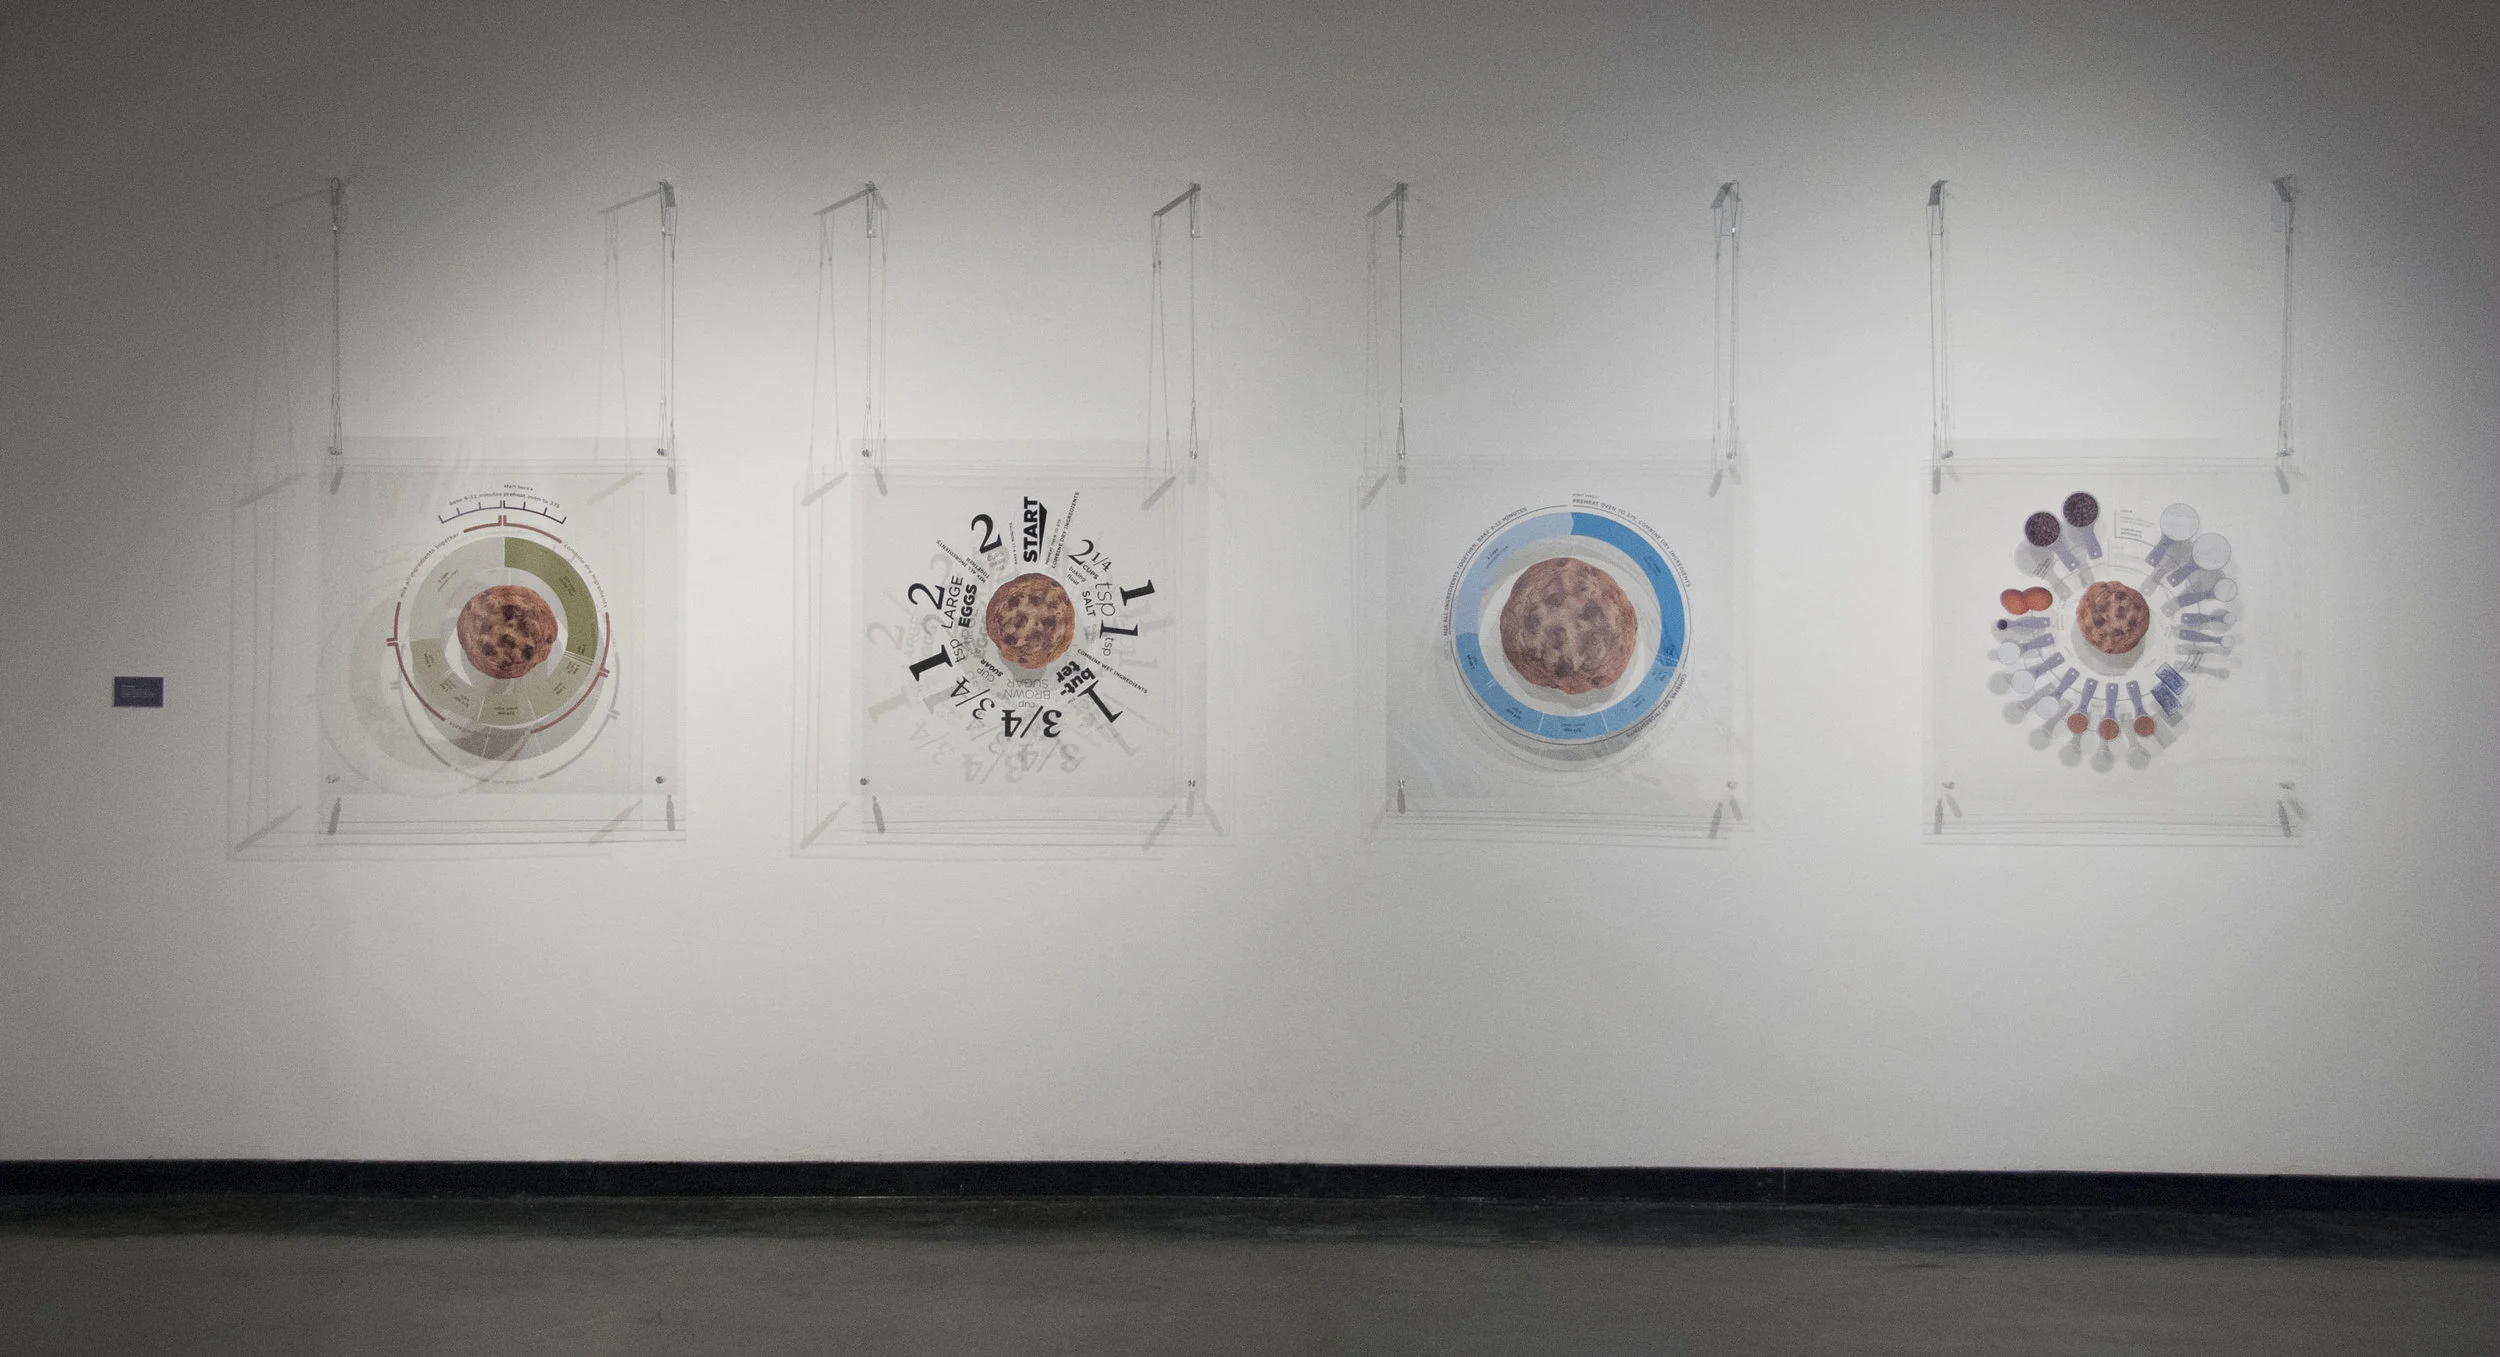
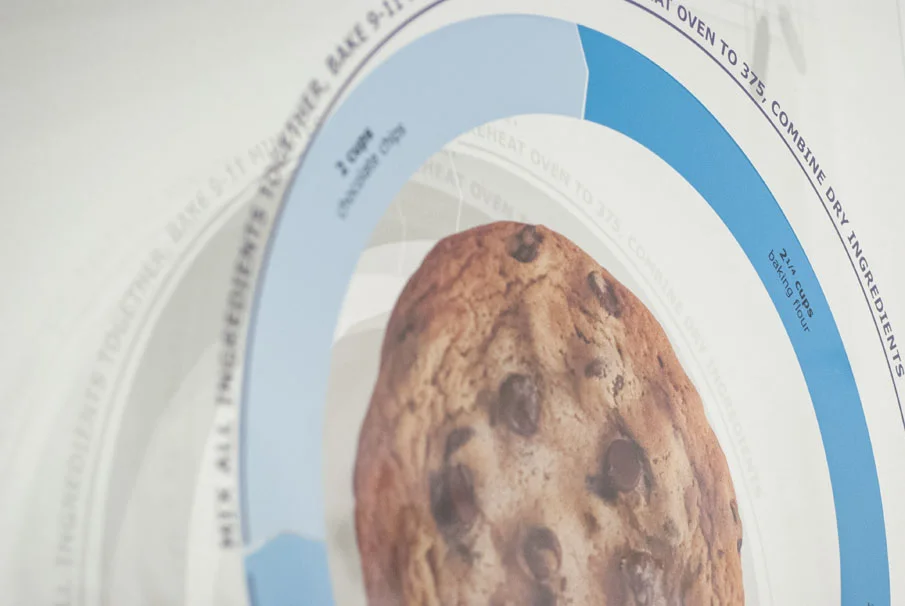
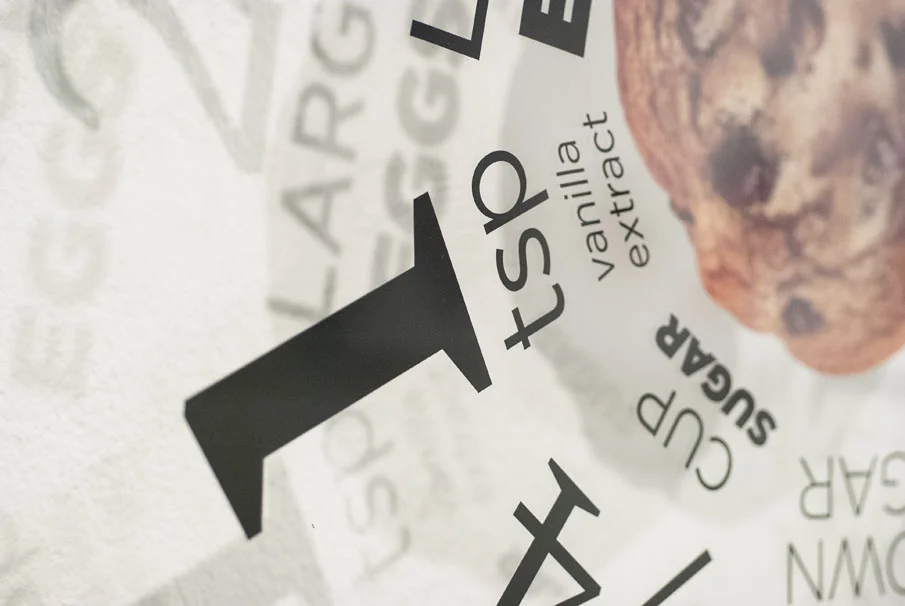
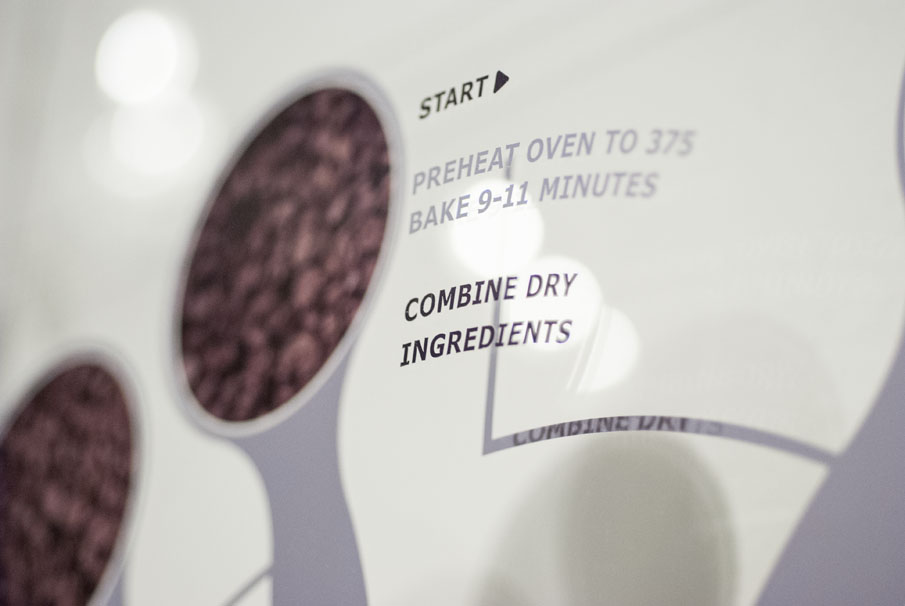
Cookie Diagrams
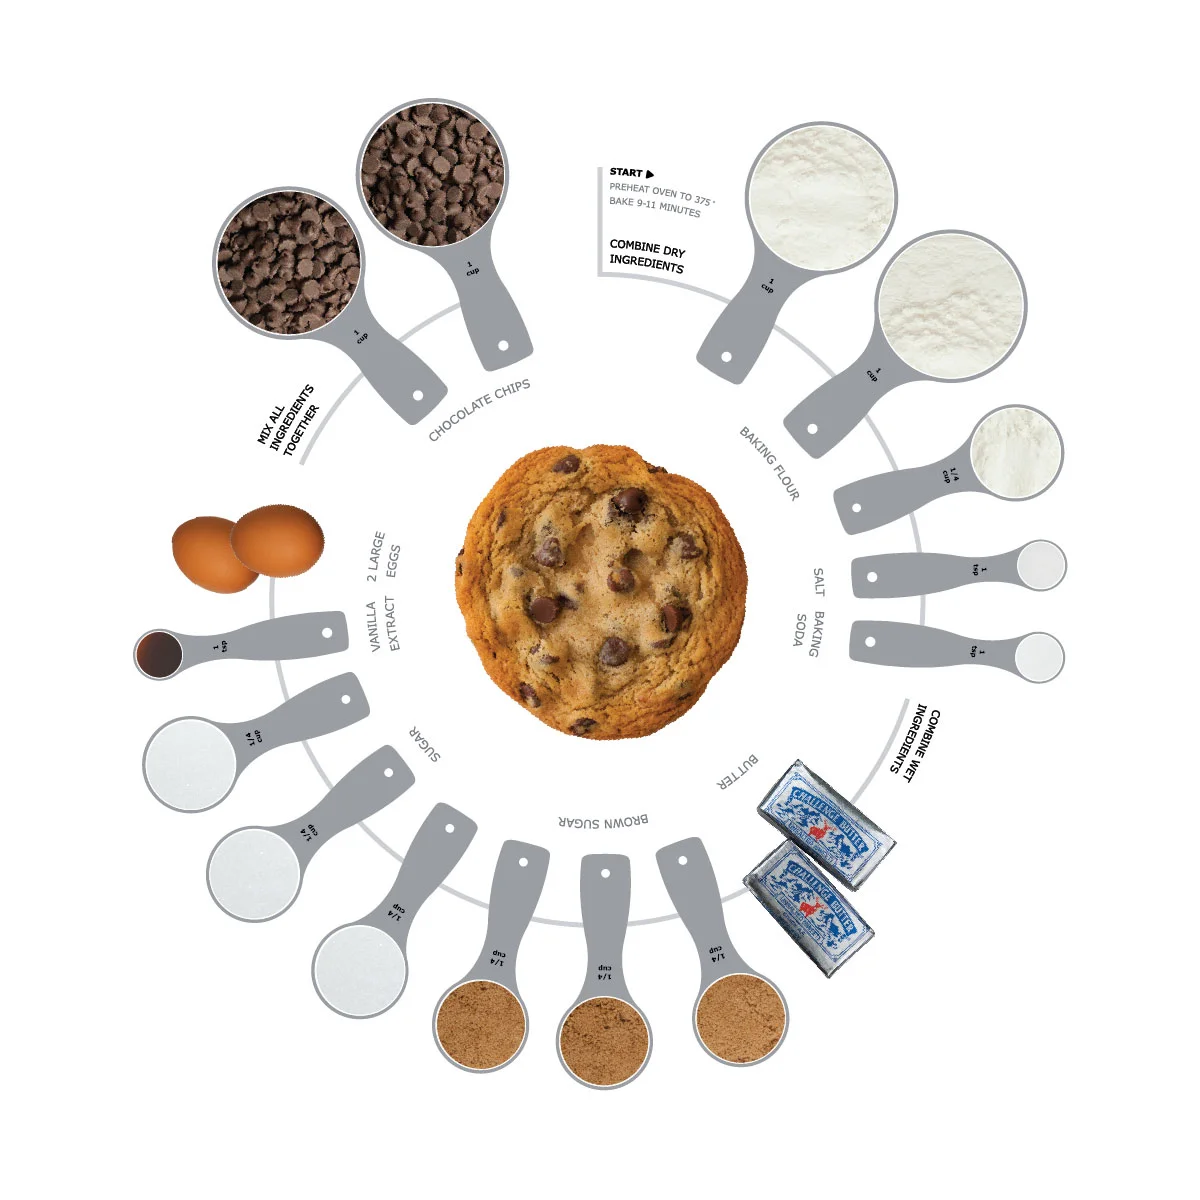
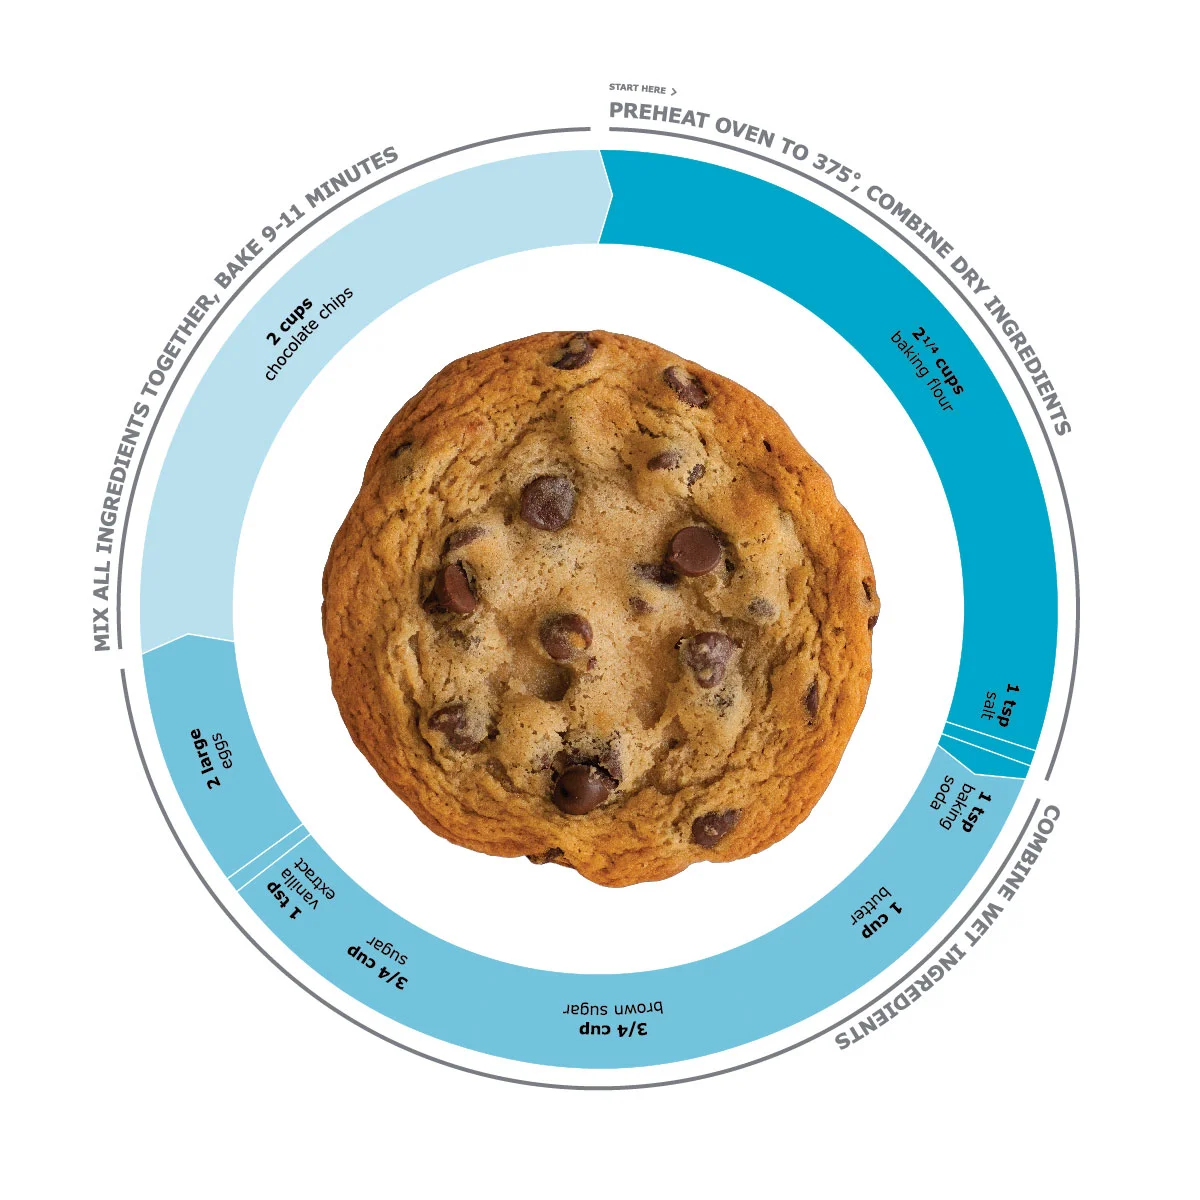
A boundary pushing graphic model created as one aspect of my MFA. Developed to read like a clock, moving clock-wise, the chocolate chip cookie recipe's instructions, ingredient order, volume, and baking directions are visualized using various forms of data visualization. These include, photography, pie charting and typography.
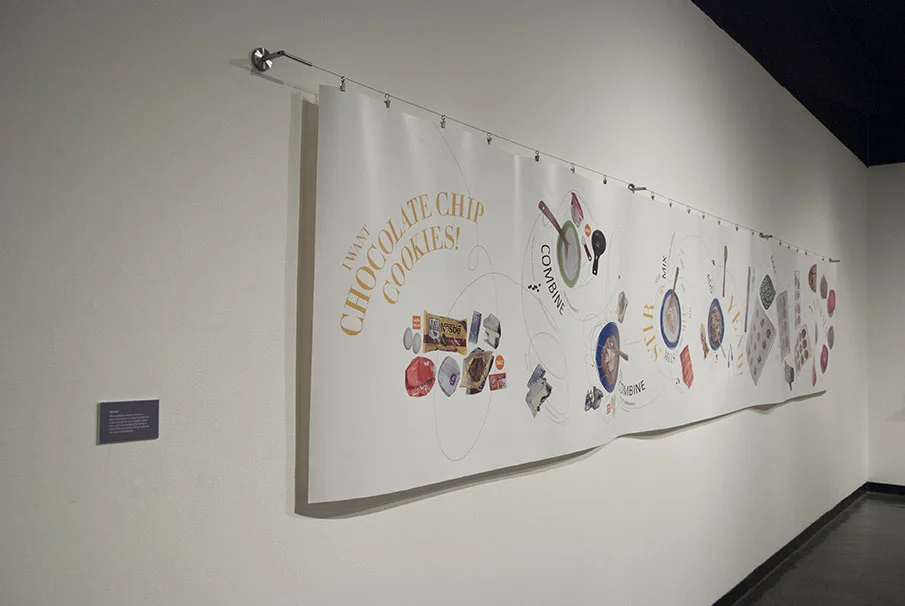
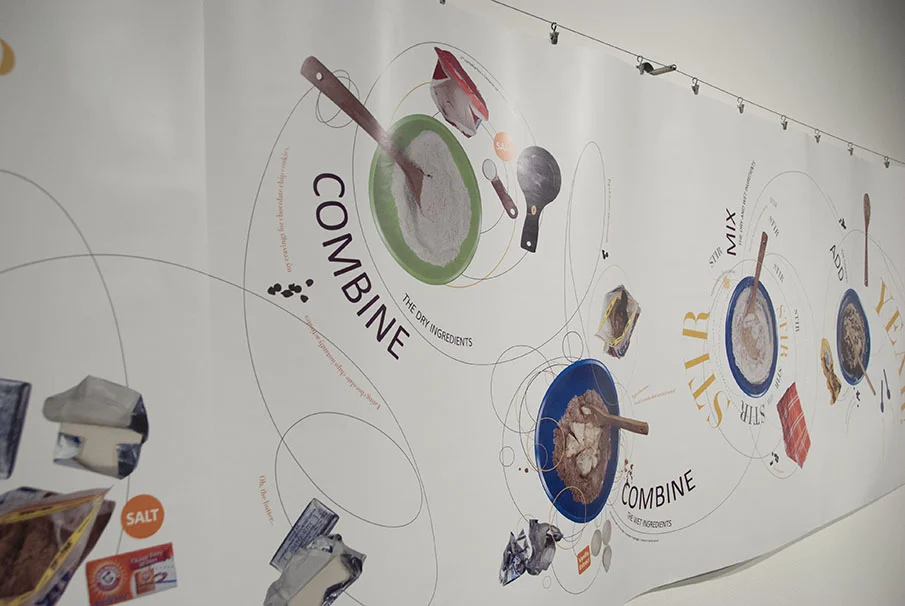
Cookie diagrams includes a series of four models.
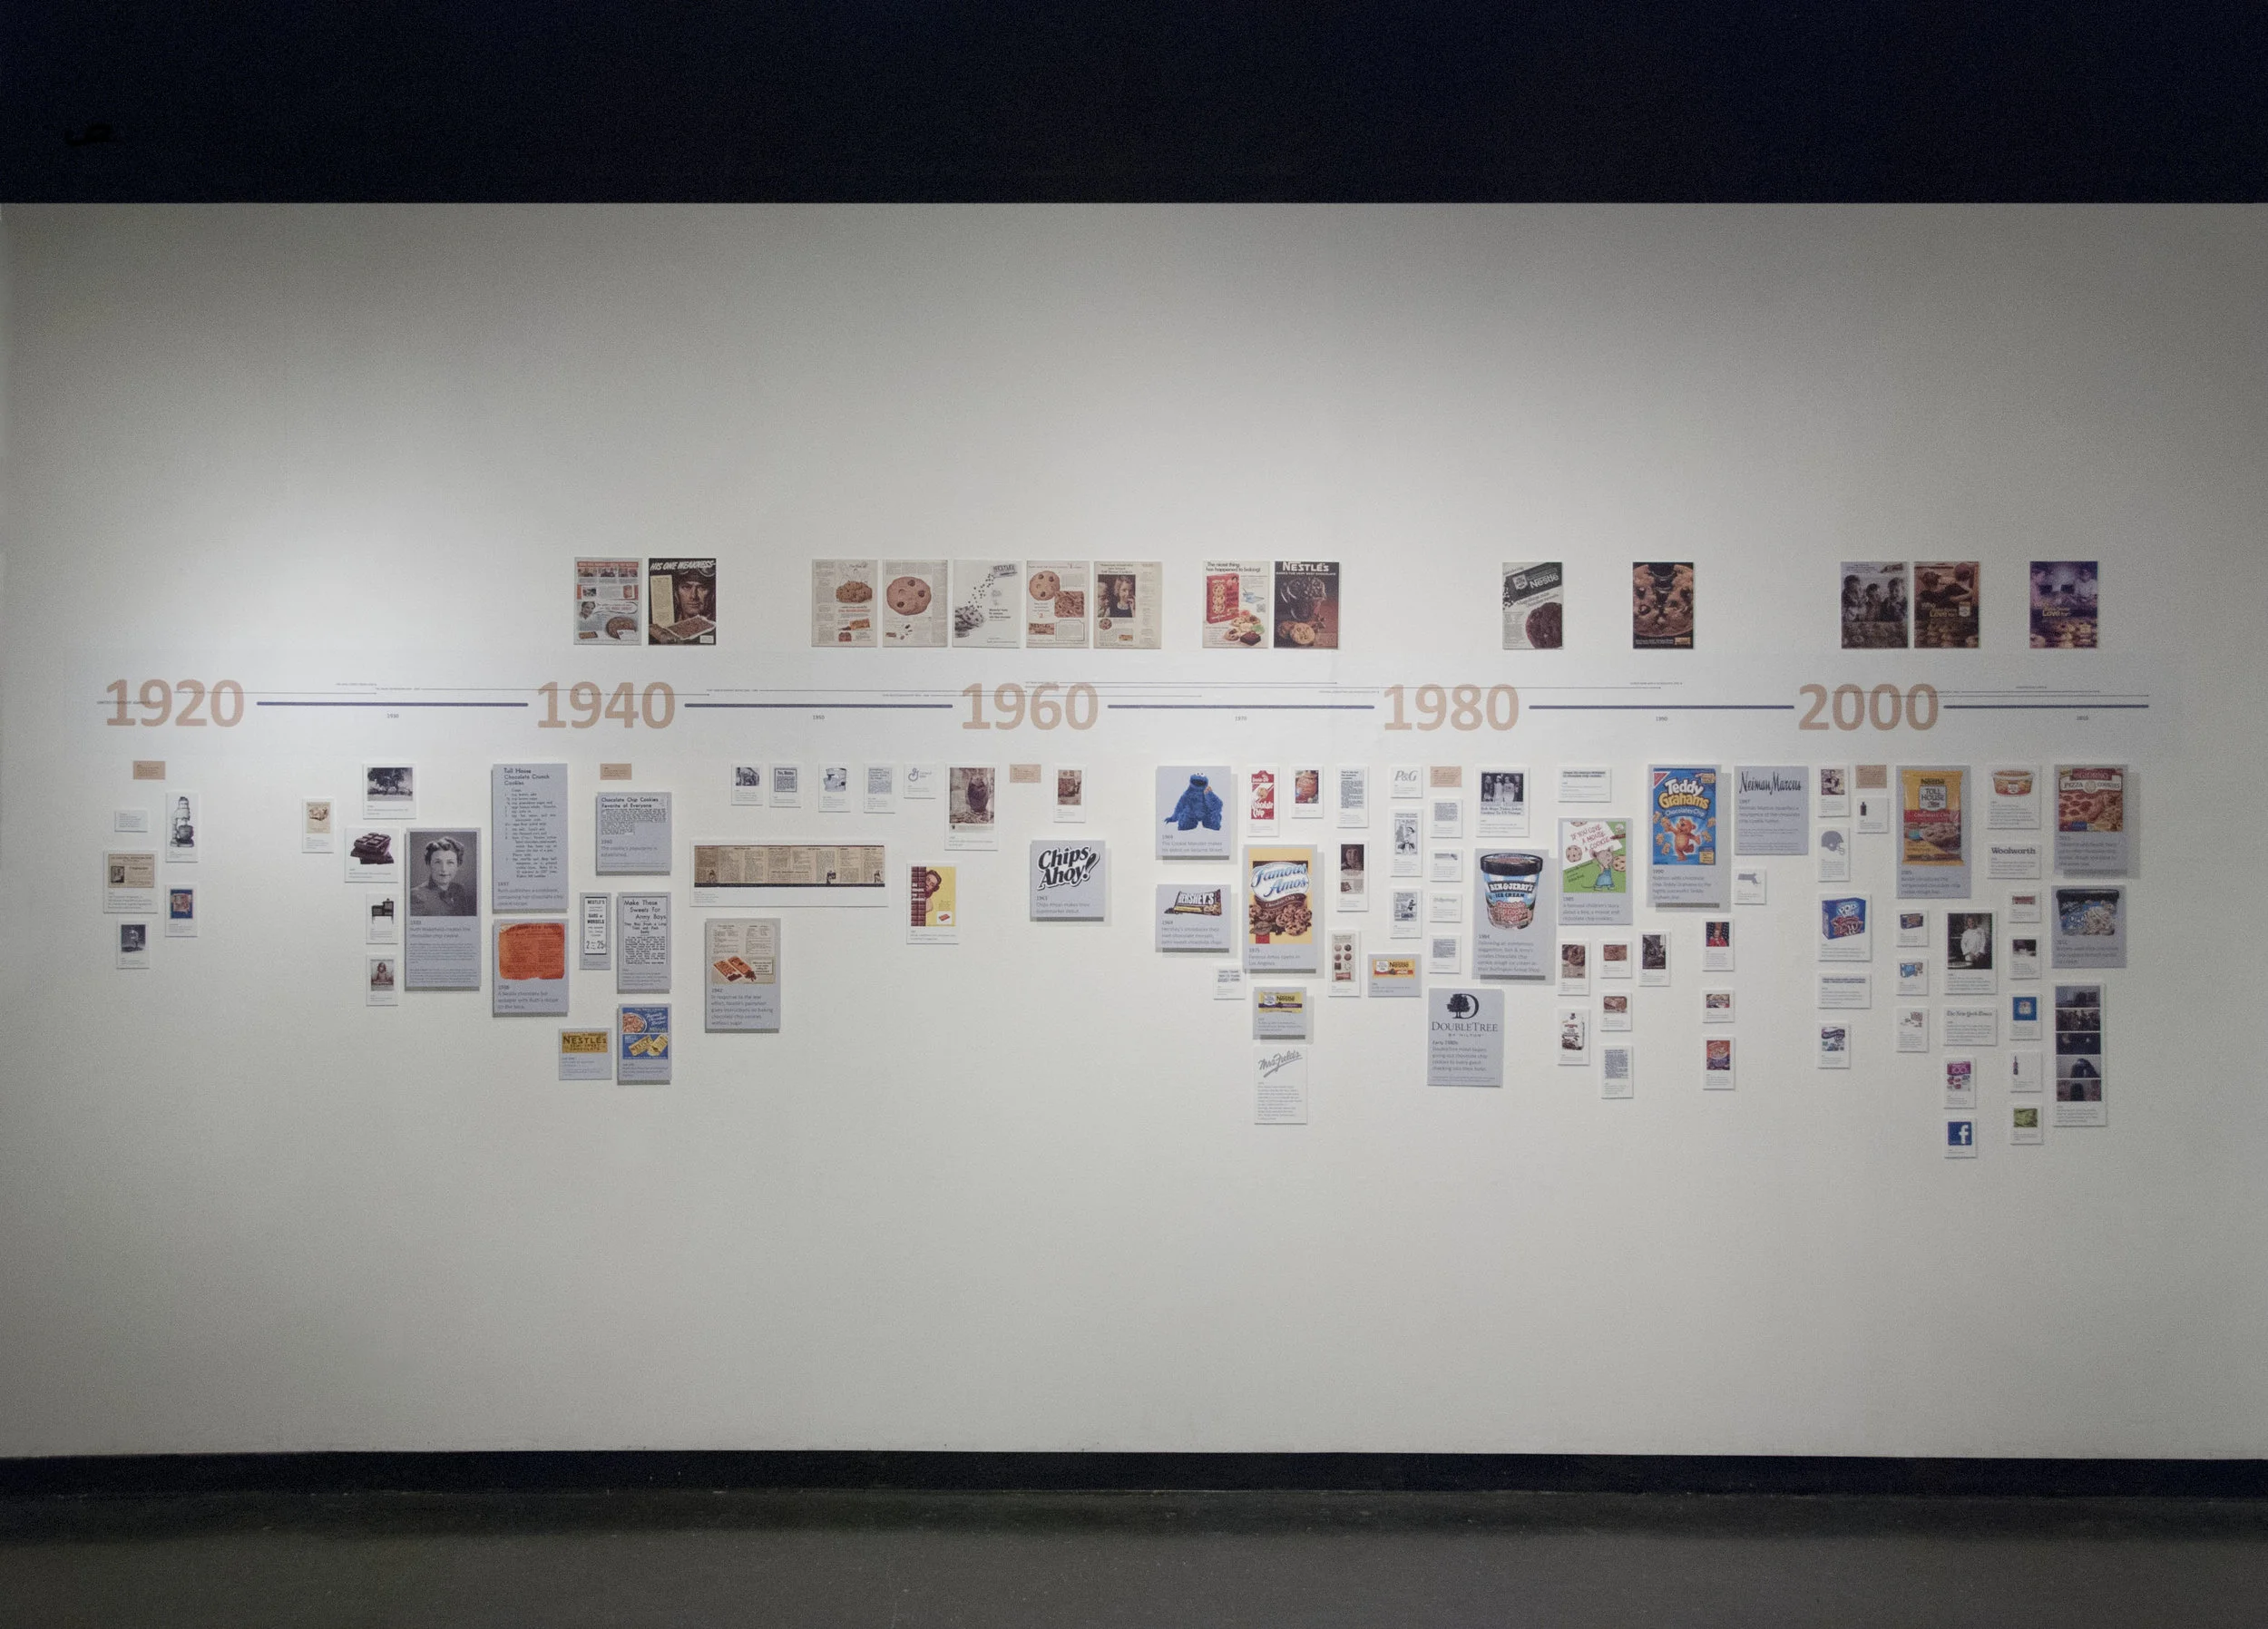
Timeline
Exploring the historical evolution of object forms, information and chocolate chip cookie recipe related content. Charting - in timeline form - I created visual interest by exploiting 3D shapes. Panels coming forward towards the viewer identify more important information, while panels receding backwards are secondary or tertiary information.
Spanning 80 years, the viewer can pinpoint the birth of the chocolate chip cookie and the its subsequent global adoption o in all its forms.


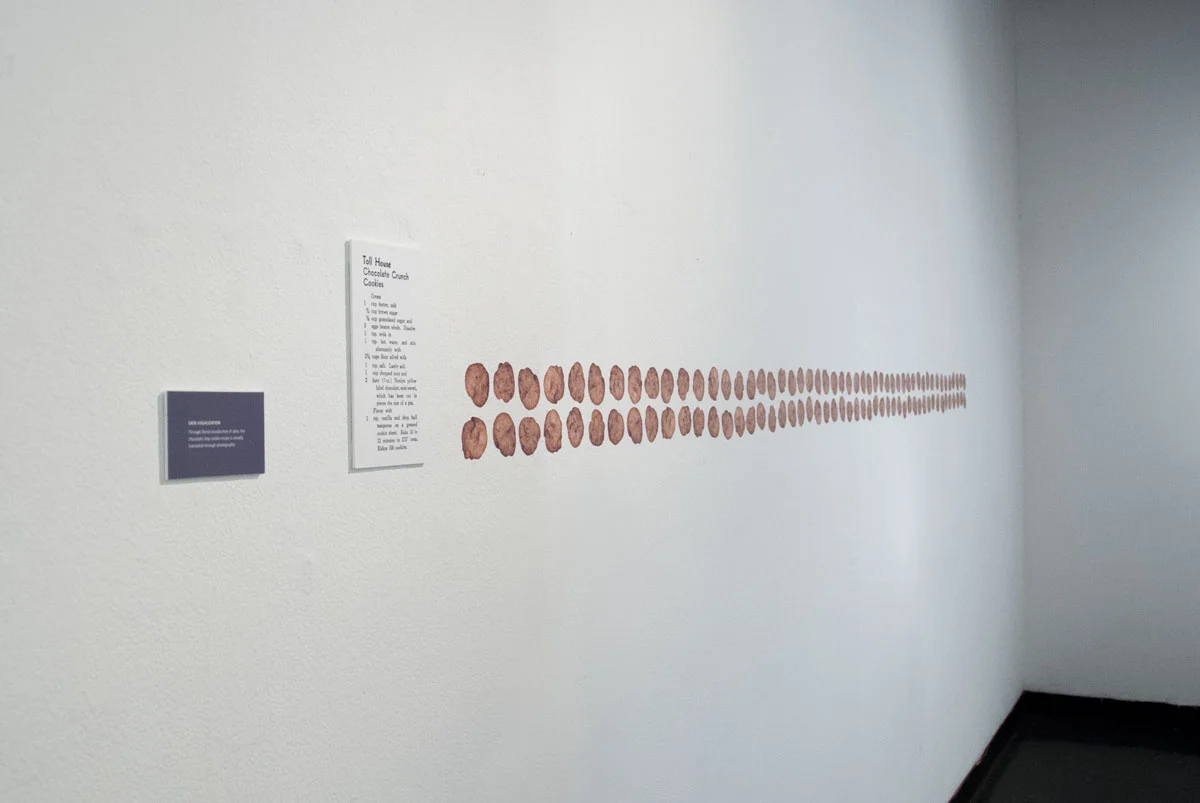
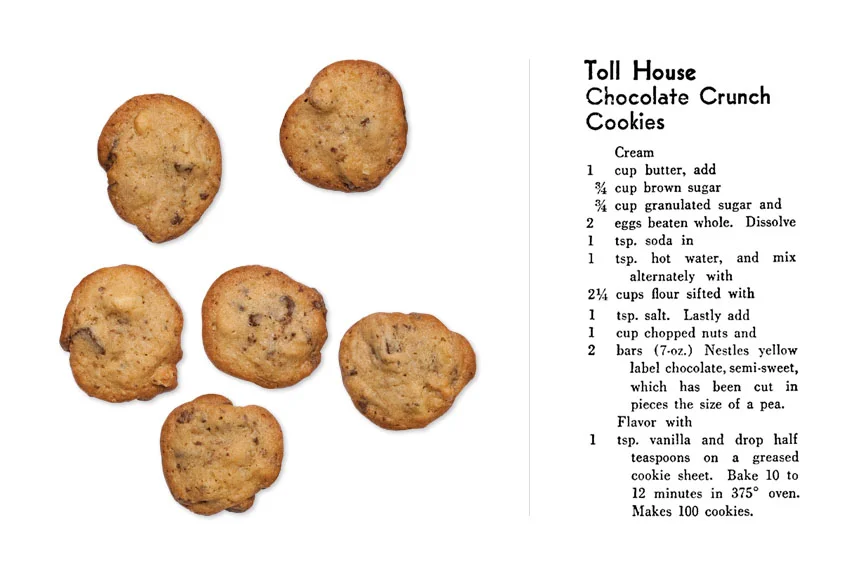
100 Cookies
Information displayed in graphic models can take on many forms. 100 Cookies represents two models simultaneously. First, the text based model (the recipe) and the recipe's yield (100 cookies). The written recipe and the 100 cookies ultimately represent the same data - ingredients mixed and specific criteria met - resulting in delicious cookies.
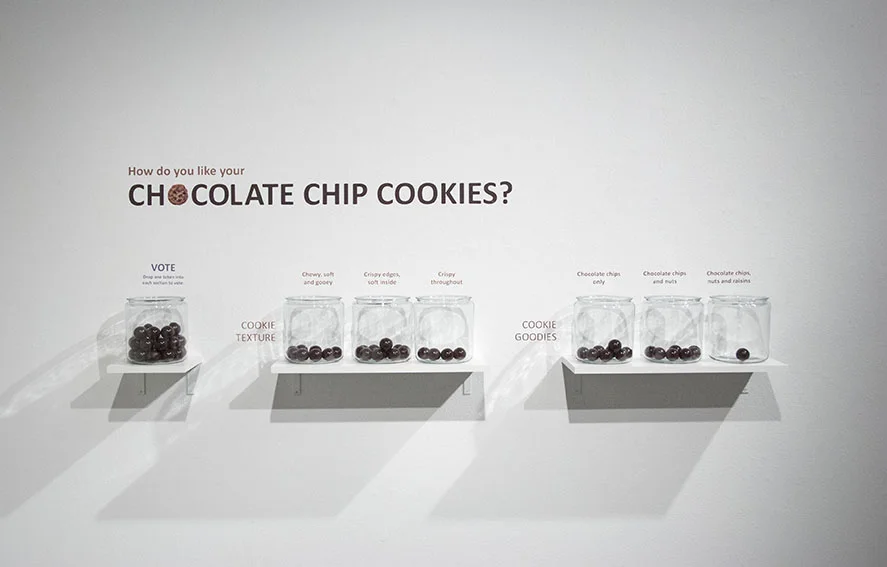
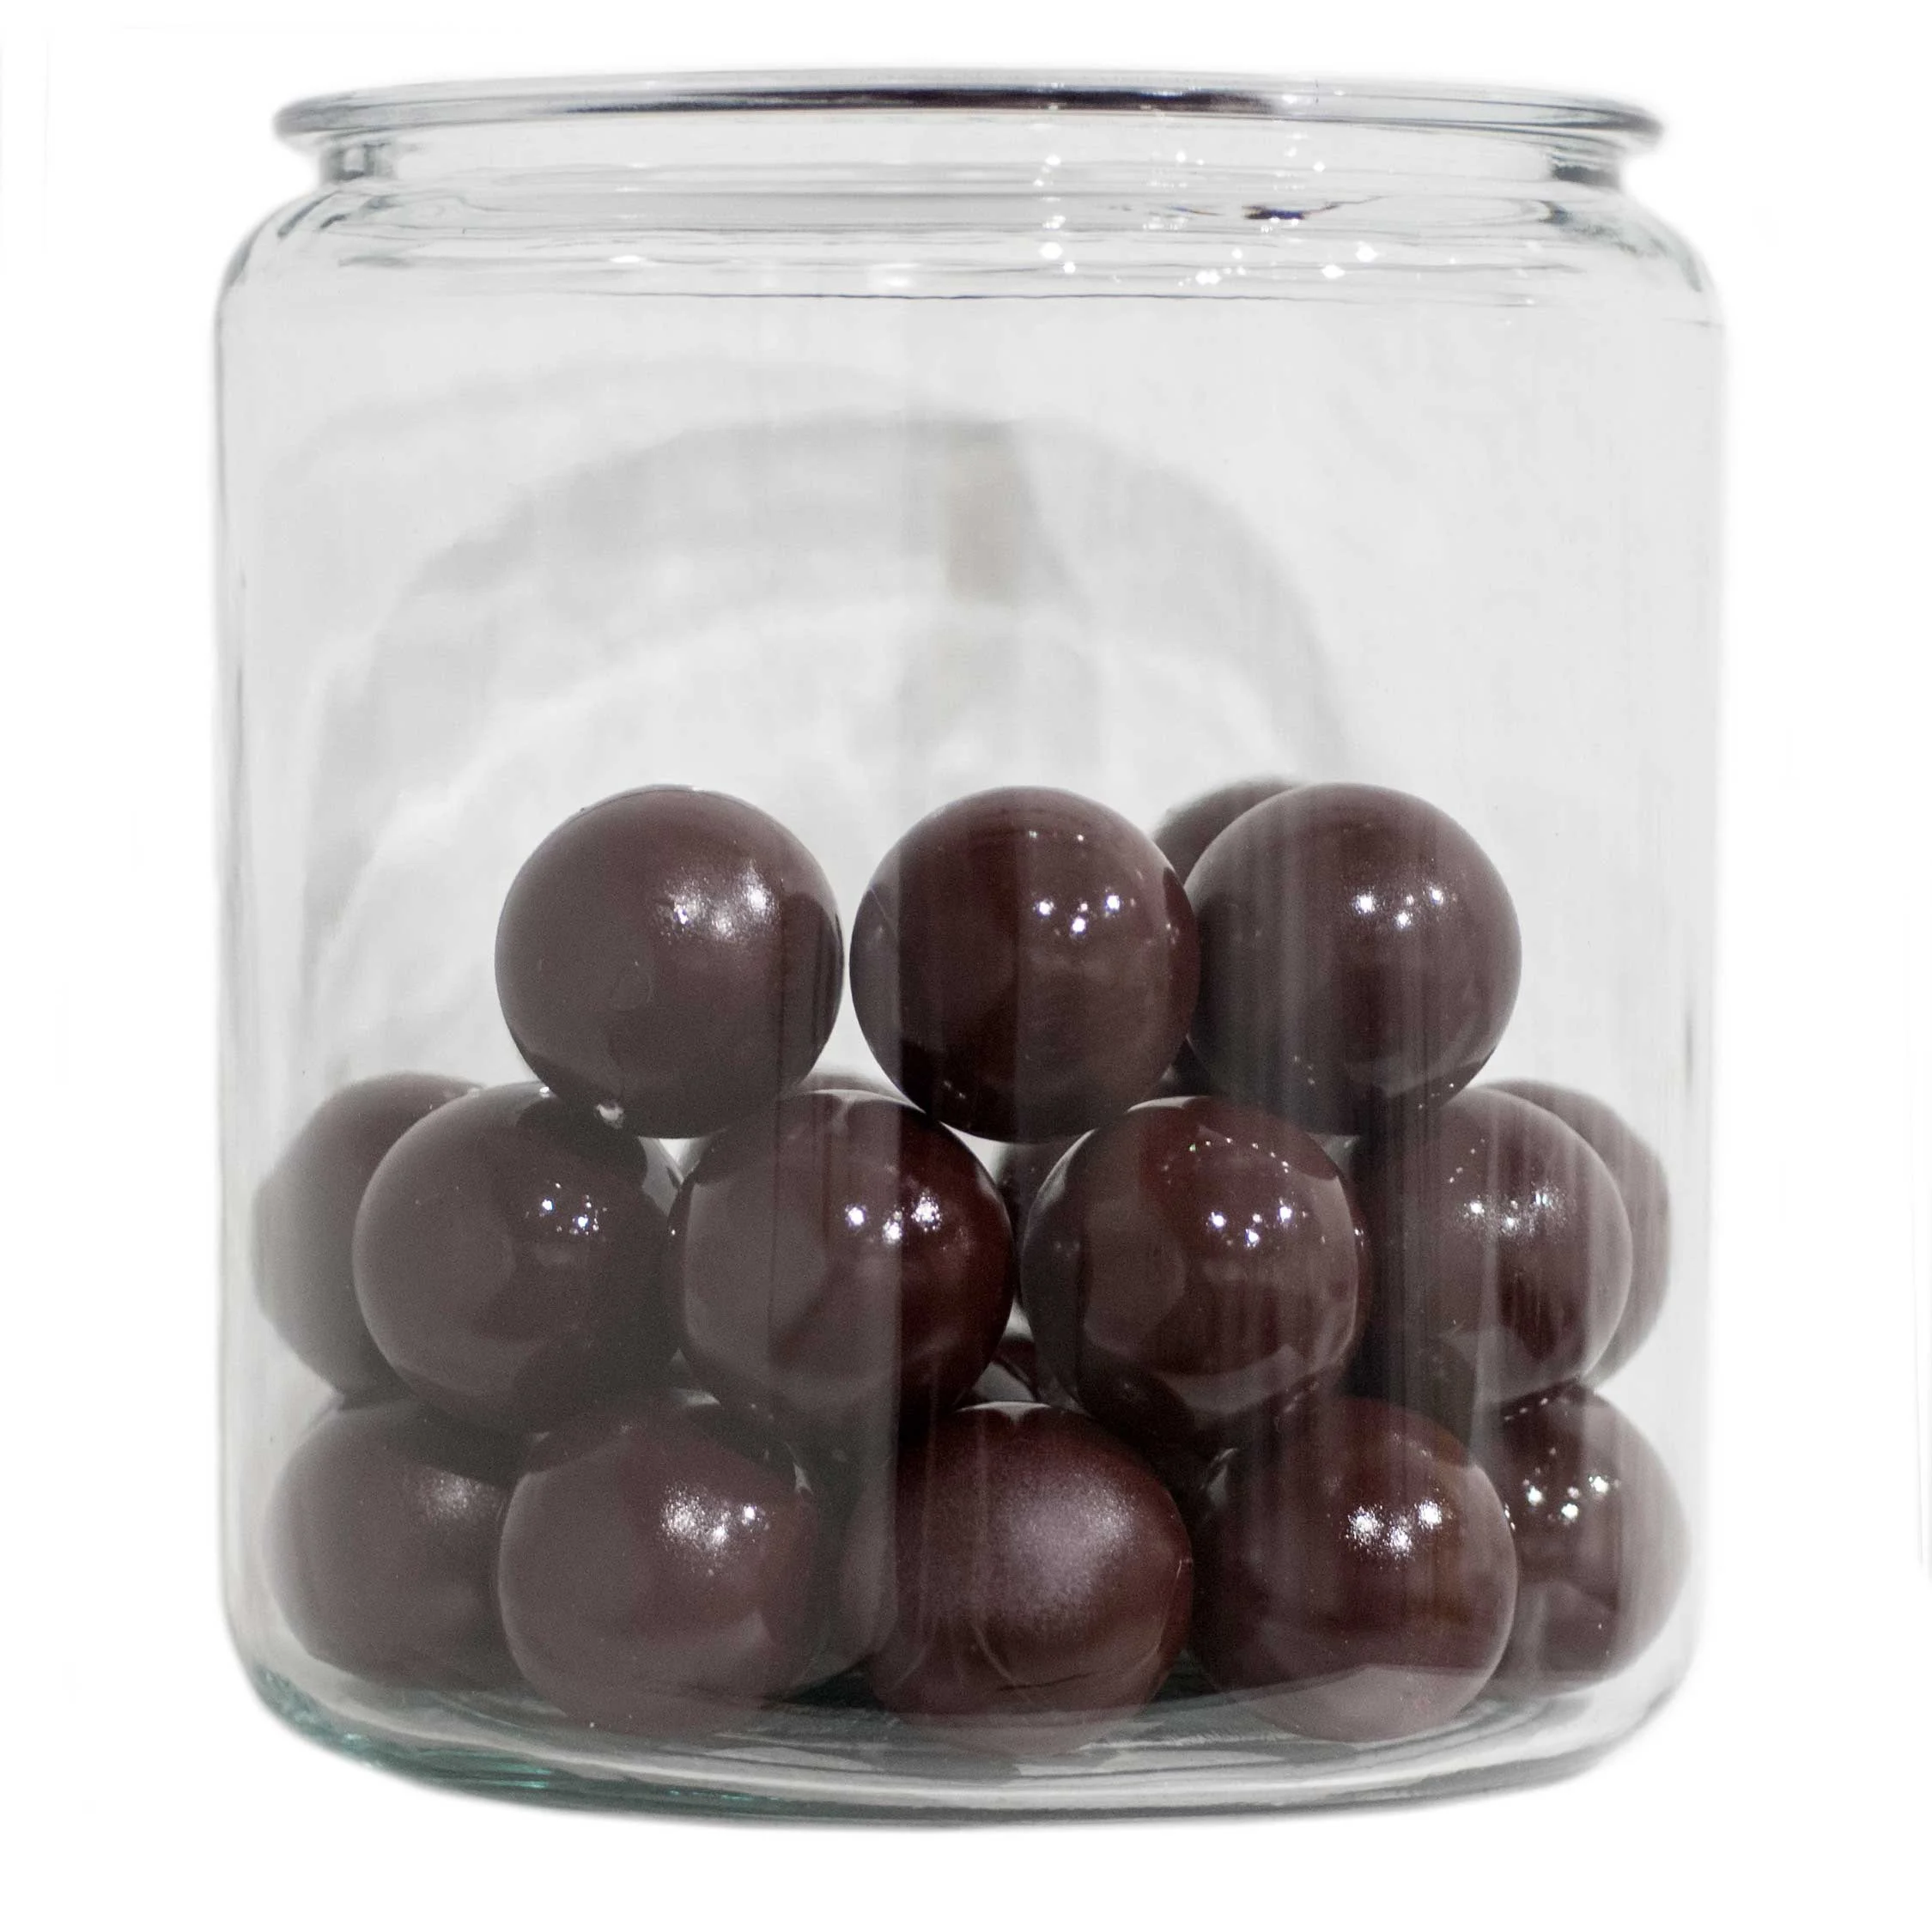
Interactive Voting
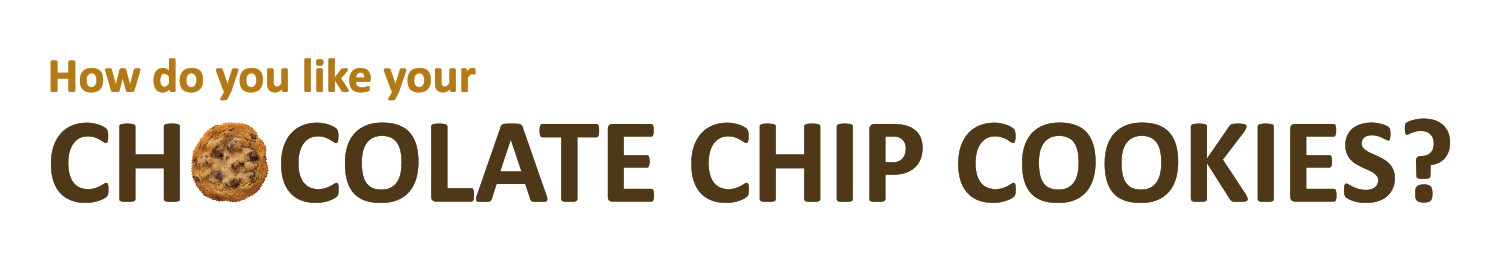
How do you like your chocolate chip cookies? This part of my exhibition encouraged audience engagement through interactive voting. Asked to answer simple questions by dropping a 'chocolate ball' into the cookie jar representing their answer. The options included selecting preferences regarding cookie texture and and cookie goodies.
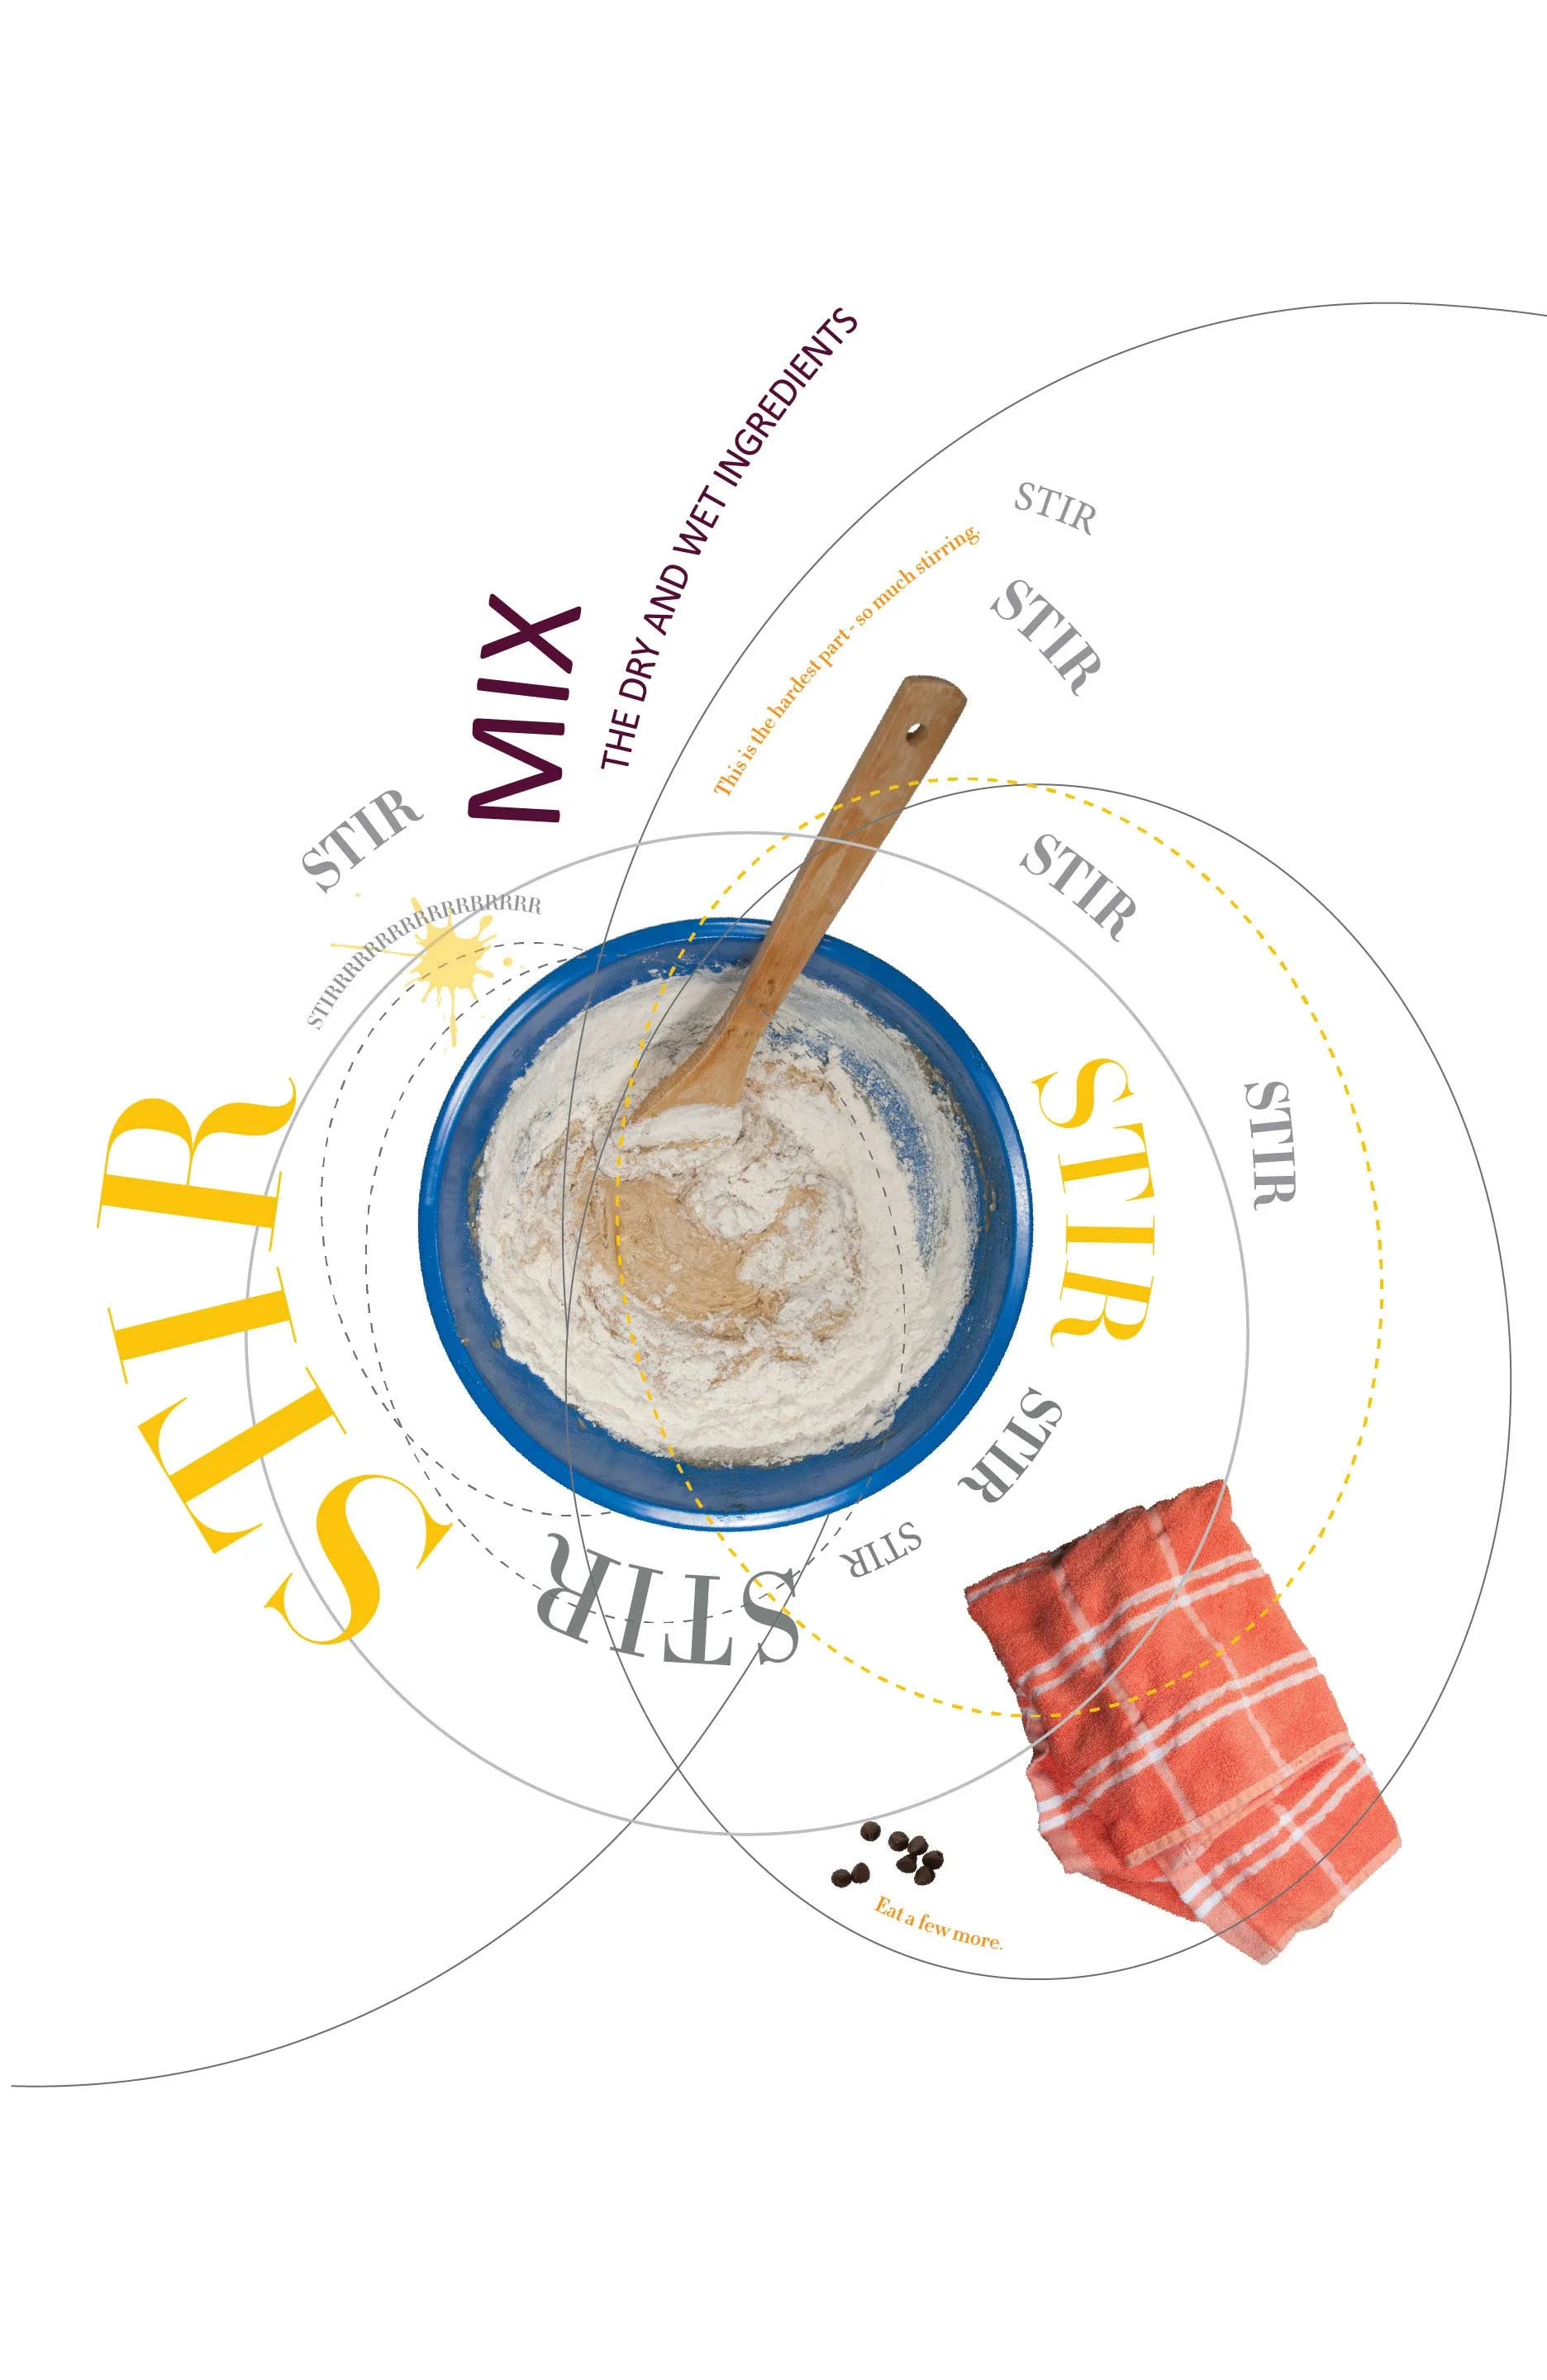
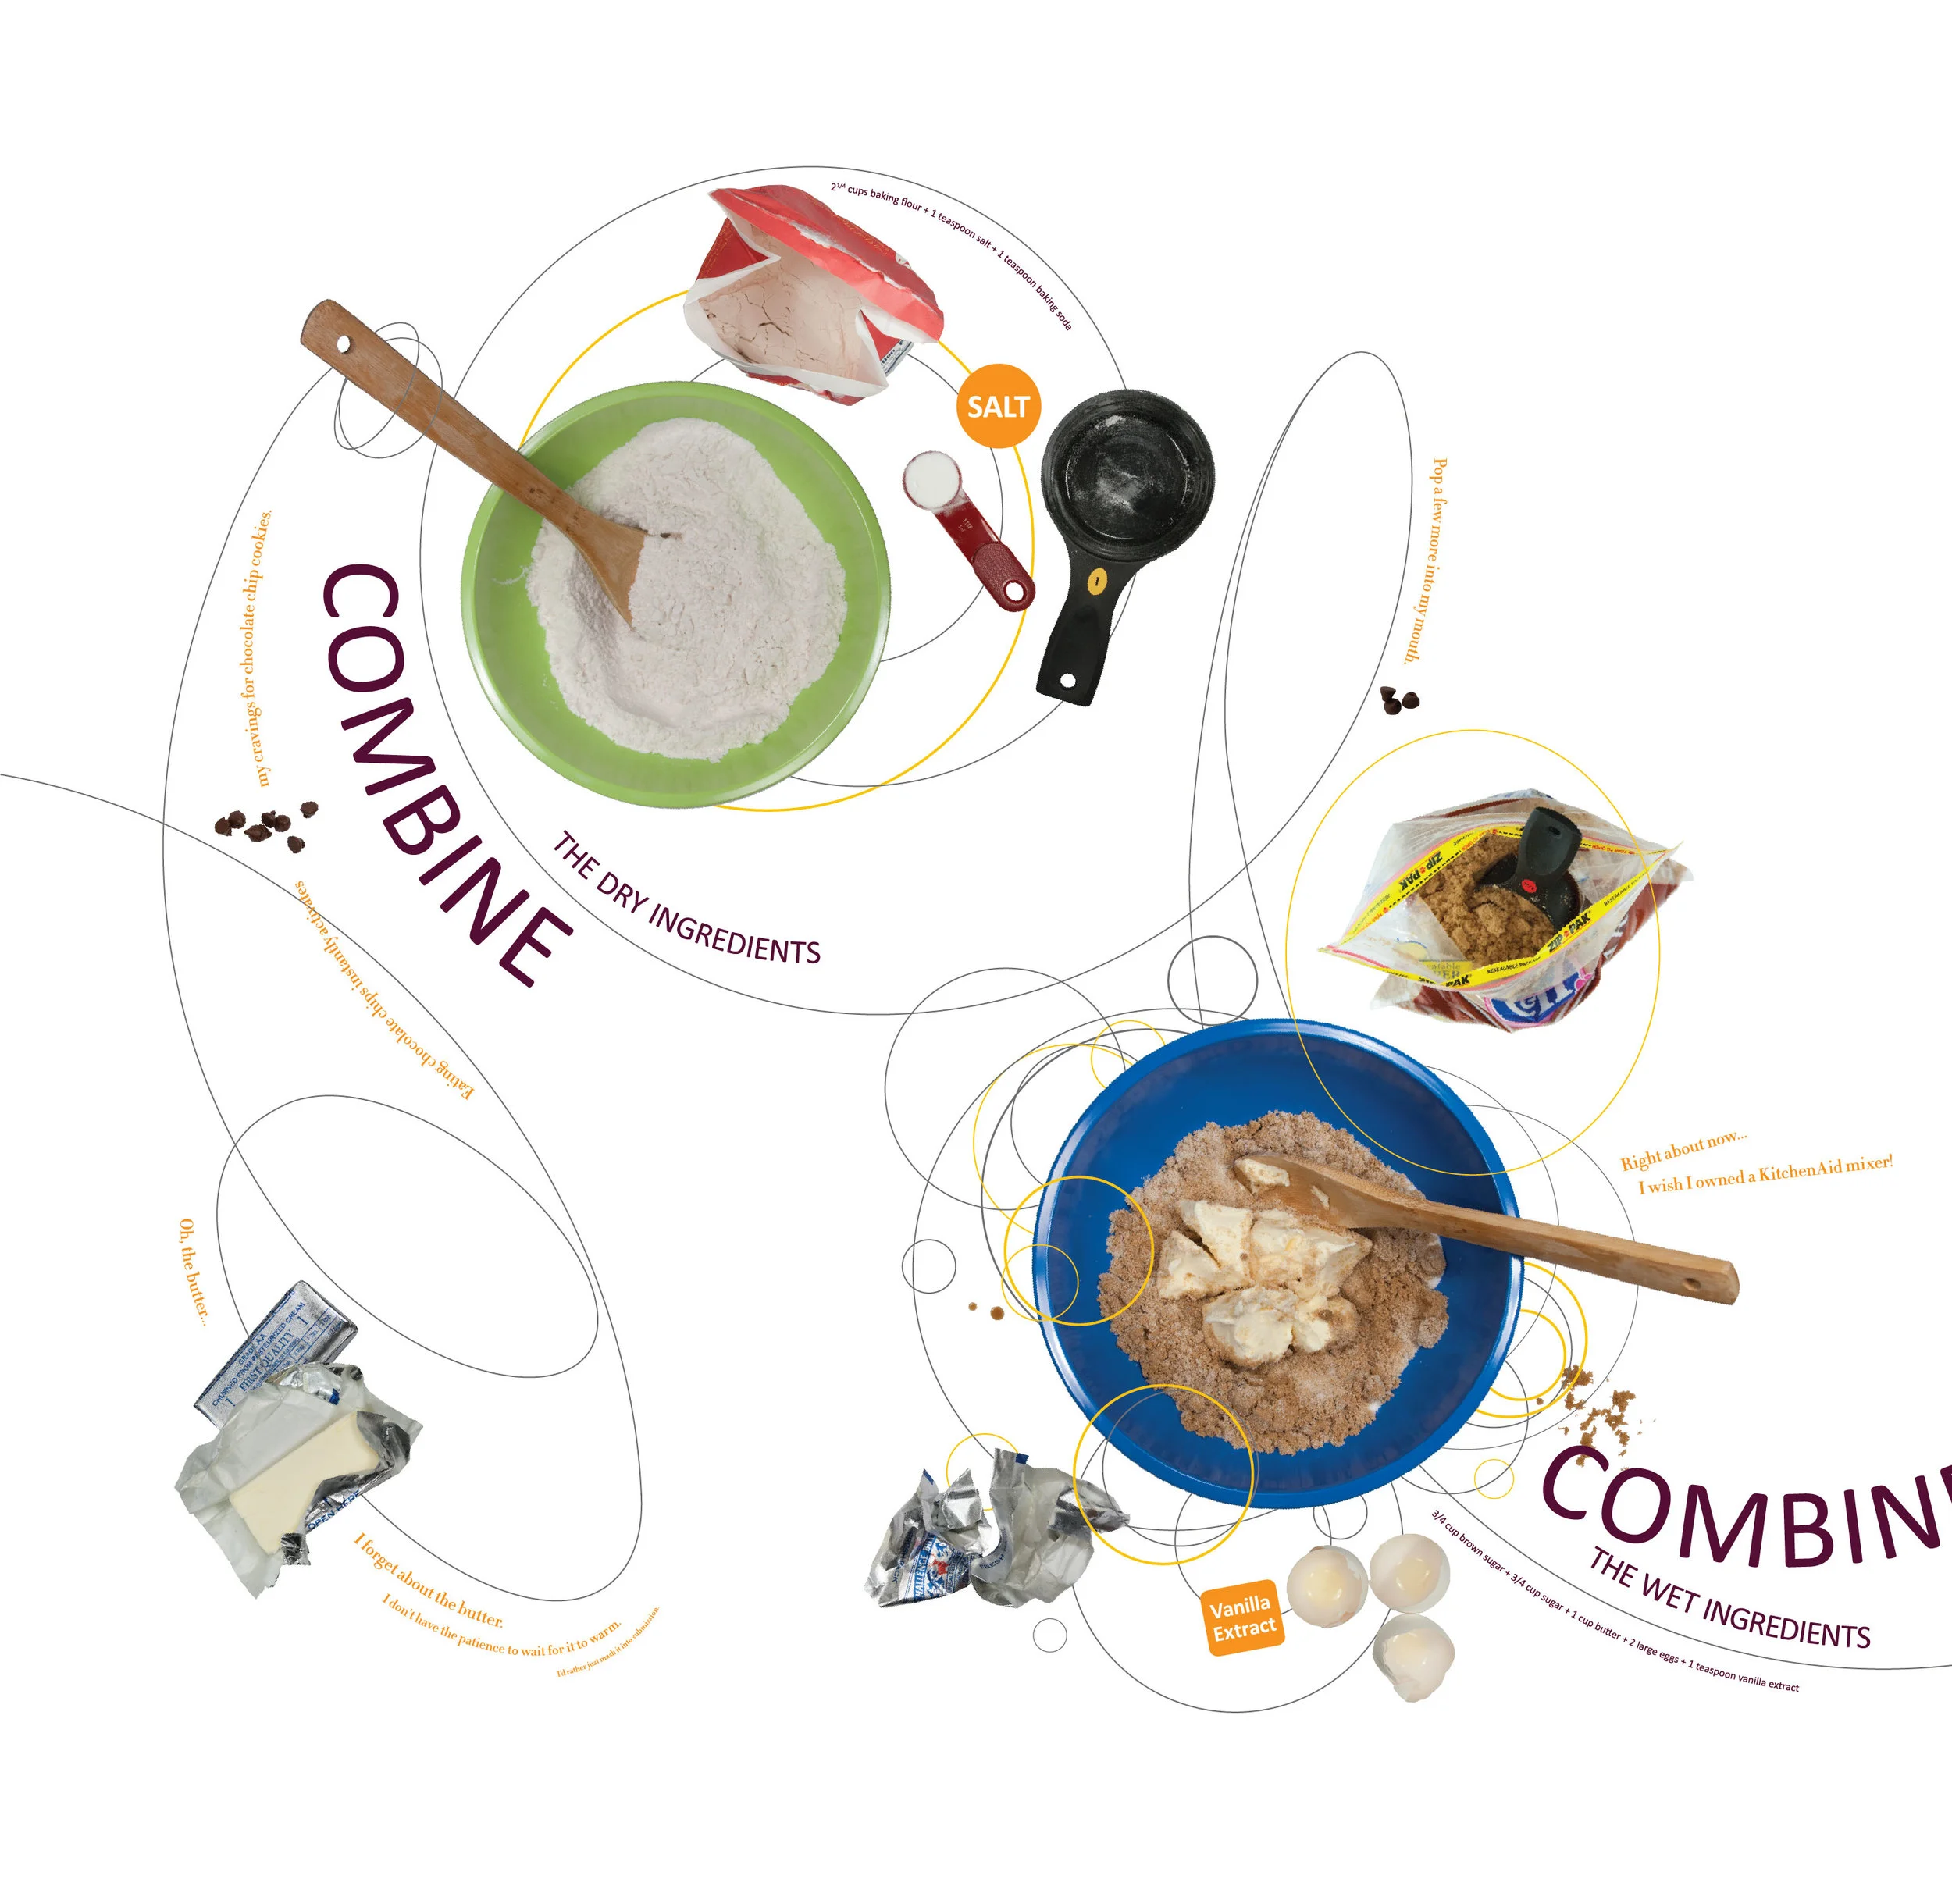
Expressive Cookie Experience
Expressive cookie experience charts my personal experience in baking chocolate chip cookies through the use of a graphic model that is open and extensible, aiming to capture time and emotion through expressive line, type, and photography.